3. General Statistical Approach
This guidance takes a broad view of groundwater monitoring and compliance. Not every site undergoes the same project life cycle stages (see Section 1.5) or is governed by the same regulations, but groundwater monitoring at every site provides data for statistical analysis that can help support decision making. Some of the statistical approaches in this document might only be applied at larger sites with extensive data sets. Others can be used at even the smallest of sites, assuming that a reasonable minimum number of measurements are collected.
Throughout the project life cycle, systematic planning should form the basis for collection and analysis of groundwater data. One of the first steps for any site is to establish a working conceptual site model (CSM)A living collection of information about a site which considers factors such as environmental and land use plans, site-specific chemical and geologic conditions, and the regulatory environment (ITRC 2007b).. The CSM is updated during the project as new information is gathered. In addition, the project planning team defines the data quality objectivesThe qualitative and quantitative statements derived for the DQO process that clarifies the study’s technical and quality objectives, defines the appropriate type of data, and specifies tolerable levels of potential decision errors that will be used as the basis for establishing the quality and quantity (USEPA 2002b). (DQOs) and then determines the appropriate type and quality of data needed to answer questions of interest. From a statistical standpoint, exploratory data analysis (EDA)An approach for initial data evaluation using graphical methods to open-mindedly explore the underlying structure and model of a dataset to aid in selection of the best statistical methods. Typical techniques are box plots, time series plots, histograms, and scatter plots (Tukey 1977; NIST/SEMATECH 2012; Unified Guidance). should generally be used to review data quality and select appropriate statistical methods.
Systematic planning results in clear data collection plans and objectives. Since appropriate and usable data are necessary for statistical analysis, this document generally assumes that groundwater data have been collected using a systematic planning process. The USEPA DQO process and the U.S. Army Corps of Engineers (USACE) technical project planning (TPP) process (USACE 1998) are two examples of systematic planning that can readily be used to help plan groundwater data collection. Additional information on systematic planning can be obtained from the following ITRC documents:
- RPO-7: Improving Environmental Site Remediation through Performance-Based Environmental Management (ITRC 2007b)
- SCM-1: Technical and Regulatory Guidance for the Triad Approach: A New Paradigm for Environmental Project Management (ITRC 2003)
- SCM-3: Triad Implementation Guide (ITRC 2007a)
This section describes a general approach for groundwater statistical evaluations, with an emphasis on CSMconceptual site model development and refinement, EDAexploratory data analysis techniques, statistical design, and the key assumptions common to groundwater statistics. This section also outlines steps used to assist in choosing an appropriate statistical method, along with options for data that have been not been collected systematically.
While statistics provides a quantitative basis for decision making, do not rely on statistics to the exclusion of other lines of evidence or to compensate for a poorly designed monitoring program. While this document focuses on the statistical analysis of groundwater measurement data, other critical lines of evidence may include related soils data, site history, soil gas measurements, groundwater flow dynamics, lithology information, and well logs. A scientifically defensible and correct decision will often require multiple lines of evidence in addition to statistics.
3.1 Introduction to Conceptual Site Models
Developing a statistical approach based on a CSMconceptual site model is an initial investment that can save significant time and money and prevent poor decisions. The site CSM should be developed before deciding on the statistical methods to be used. A CSM is developed using site information such as information about sources, geology, hydrogeology, land use, and soil and groundwater data generated at sampling points from different locations on a site. Groundwater sampling points (or sampling locations) are most often monitoring wells, but could be other types of sampling such as direct push sampling, temporary probes, or field sensors. Locations may be upgradient of a release and plume, downgradient, side gradient, or within a groundwater plume. For some sites it is important to determine whether intrawellComparison of measurements over time at one monitoring well (Unified Guidance). or interwell statistical testingStatistical analyses of data collected from different monitoring wells (Unified Guidance). will be useful. An example is presented below to illustrate comparing intrawell and interwell statistical testing.
An example in which knowledge of the working CSMconceptual site model can help is the choice between intrawellComparison of measurements over time at one monitoring well (Unified Guidance). and interwellComparisons between two monitoring wells separated spatially (Unified Guidance). statistical testing. Traditional interwellComparisons between two monitoring wells separated spatially (Unified Guidance). tests compare upgradient backgroundNatural or baseline groundwater quality at a site that can be characterized by upgradient, historical, or sometimes cross-gradient water quality (Unified Guidance). data with downgradient compliance well measurements. Groundwater compliance is then assessed by whether the downgradient values exceed background. At many sites, however, one or more of the monitored parameters occurs naturally in groundwater and varies substantially across the site due to natural geochemical factorsGeologic/chemical parameters such as oxidation/reduction potential, nitrate, and sulfate that may influence the distribution, concentration, or persistence of contaminants in the subsurface. (thus exhibiting natural spatial variabilitySpatial variability exists when the distribution or pattern of concentration measurements changes from well location to well location (most typically in the form of differing mean concentrations). Such variation may be natural or synthetic, depending on whether it is caused by natural or artificial factors (Unified Guidance).). At these sites, parameter concentrations larger than upgradient background might be attributed to contamination when the differences are actually natural and due to the locally-varying distribution of groundwater chemicals.
A statistical approach that first checks for statistically measurable spatial variability and, if present and natural in origin, then uses intrawell testing at each compliance well instead of interwell comparisons will likely avoid misleading conclusions. Intrawell testing compares earlier versus more recent data at the same sampling pointA specific spatial location from which groundwater is being sampled.. Because the comparison is made at a single sampling point, concentration differences between wells due to natural spatial factors do not affect intrawell tests. Only changes over time (indicating a trend or shift in concentration level) cause an intrawell test to be statistically significant and to show a change in groundwater quality.
Note above the importance of the qualifier ‘natural in origin’ when characterizing spatial variability. Compliance wells situated in the middle of a plume vary spatially from upgradient background wells, but in that case the variation is anthropogenic and indicative of contamination. Intrawell testing in those circumstances might not be helpful and could even obscure evidence of the plume. Note also that while natural spatial variation is a likely characteristic of most sites, it may not always be easy to identify. The variation may be real but low-level, in which case intrawell testing may be unnecessary. Or, the variation may be stronger but difficult to observe due to a small sample of measurements or a small number of sampling points.
Example: Natural Spatial Variability
Figure 3-1 below describes a landfill located just north of a coastal river. Measurements of specific conductance at the site consistently showed much higher (and statistically significant) readings at all three downgradient wells compared to upgradient background. Further investigation found, however, that the higher compliance point values of specific conductance were due to natural infiltration of salt water into the downgradient wells, due to tidal fluctuations where the river met the sea, and not groundwater contamination by the landfill. Only a refinement of the initial CSM captured this important feature of the groundwater system and allowed the cause of the spatial variation to be identified.
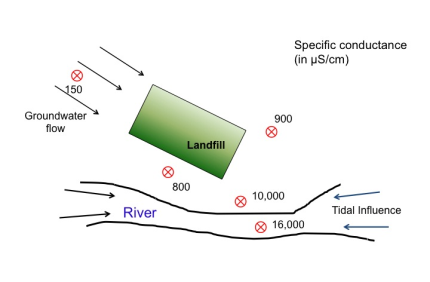
Source: Adapted from USEPA 2009.
The example site shown in Figure 3-1 illustrates the importance of developing a CSM prior to statistical evaluations and of refining the CSM on a periodic basis. The site-specific conditions and hydrogeology must be understood well enough to select a proper statistical approach, part of which will involve answering the following questions:
- Has background been selected from the right locations and is it statistically representative of local background conditions?
- Are the parameters of concern likely to be normally distributed?
- Will specific approaches or methods be needed to account for frequent nondetectsLaboratory analytical result known only to be below the method detection limit (MDL), or reporting limit (RL); see "censored data" (Unified Guidance).?
- Are historical data representative of current groundwater quality, or have local conditions changed over time?
- Are enough data either available or planned for collection to enable accurate and statistically powerful testing and decision-making?
3.2 Developing a Conceptual Site Model
An initial CSMconceptual site model is essential to formulating a statistical approach as well as to deciding which data and analyses are appropriate for the current stage of the project.
3.2.1 Target Population
For statistical purposes, knowledge about a site’s hydrogeology and its CSM is critical for determining the nature and stability of the target population of groundwater measurements. In a highly stable, homogeneous, sandy geologic environment, groundwater concentrations may be fairly consistent over time. In a highly fractured or karst environment, significant discontinuities may exist in concentrations, even at nearby wells. For all sites, changes over time in regional conditions (such as a multi-year drought) may cause groundwater concentrations to change so much that past data may not be similar to more recent measurements. In that case, more than one target population may exist, with the newer population no longer being statistically the same as the older population, even though collected from the same site.
Understanding Target Populations
Perhaps the best way to make sense of sampling data is to understand the target population of measurements from which those data are drawn. For instance, an aquifer system may be conceptualized as a complex, dynamic four-dimensional object, with three dimensions representing groundwater subsurface volume over a prescribed boundary and depth, and one representing time. Physical groundwater samples are collected at specific locations and depths within the three-dimensional volume, but also at certain points in time. The target population associated with a given set of measurements could represent the entire history of the aquifer, but more commonly the goal is to say something about a specific time period or a specific hydrostratigraphic unit or layer, for instance, shallow zone circa 2013 or the local aquifer surrounding well A-1 over the past two years. Any statistical conclusion (or inference) drawn from the data only applies to the target population, so defining or understanding that target is of prime importance.
Since a CSMconceptual site model treats the subsurface as a dynamic, four-dimensional object, the best statistics will result from a clear understanding of the target population(s) of measured values. The target population refers to the entirety of the parameter of interest (such as the pH of an aquifer or the rangeThe difference between the largest value and smallest value in a dataset (NIST/SEMATECH 2012). of trichloroethylene concentrations within a plume). In statistics, ‘population’ is the total amount of a property and is generally defined by both spatial and temporal boundaries. Project managers should try to assess whether there is one homogenous population, many distinct localized populations, different populations by subsurface depth, populations that change over time, or some combination of these conditions. The relevant populations of measured values and groundwater flow at the site will affect sample point placement, sampling frequency, background data definition, and the number of sample values and sampling points needed for reliable characterization.
Environmental populations generally cannot be fully characterized (that is, by analyzing every portion of soil at a waste site or all possible volumes of groundwater in an aquifer), so a statistical sample is drawn to represent a population. For example, it is possible to measure the concentration of a contaminant at a finite series of sampling events (for example, quarterly) over years, but it may not be practical to collect and analyze a continuous stream of samples over the same time frame. A representative sample is one with key statistical characteristics that parallel the characteristics of the target population.
Any decision made regarding the target population should be based on sample data collected from that target. Likewise, any statistical inferenceConclusions drawn from observed data without seeing all of the possible data (Unified Guidance). applies only to the target population and not necessarily to other populations. For instance, arsenic concentrations that exceed a regulatory limit during one year at one specific sampling point do not imply that arsenic concentrations will necessarily exceed the limit in successive years, or that arsenic concentrations exceed the limit at other well locations.
Defining the target groundwater population involves at least two tasks. The first task is to delineate the area of concern and note any clearly defined hydraulic boundaries or concentration change points that make for logical bounds. Consider the size of this area: too large an area may result in ‘watering down’ the parameter of interest (for example, the site-wide meanThe arithmetic average of a sample set that estimates the middle of a statistical distribution (Unified Guidance). concentration), while too small an area may miss areas of potential contamination.
The second task is to define the temporal extent. What period of time is of interest? Is this a one-time evaluation or will the assessment involve multiple sampling events over time? If the groundwater system under study is highly dynamic, consider the age of existing data, since it may no longer represent current conditions. More frequent sampling may be required in areas where concentrations of contaminants change more rapidly or fluctuate on a seasonal basis, unless the variability of sample results is low relative to criteria.
Two important, often related questions in defining target populations are (1) is there a single target population or perhaps several? and (2) what is the decision support required of the existing or planned sampling data? Even when areal and temporal extents have been determined, a dynamic four-dimensional subsurface (time plus volume) may more appropriately be regarded as a series of distinct populations, including perhaps:
- separate aquifer units
- distinct hydrostratigraphic layers
- highly localized geochemistry, leading to substantial spatial variability among well locations and a separate target population per well
In this setting, consider what kinds of decisions or inferences the available data allow. In a dynamic environment with substantial natural spatial variation, one sample at a single well or sampling point could never spatially characterize the site as a whole nor the local groundwater population in the well’s zone of influence, since that one measurement would only provide a ‘snapshot’ of groundwater quality and give no information about temporal changes or trends. Even a larger number of measurements may not provide adequate information if coverage of the spatial and temporal extents of the target population are not taken into account.
If the existing data provide limited coverage (either spatial or temporal) then additional sampling is likely required. Spatial coverage is limited if not all hydrological zones have been characterized. Contaminant concentrations that vary substantially between locations signify high spatial variability and may require greater sample density. Temporal coverage may be insufficient if very few measurements are collected during the time interval of interest at a given sampling point, especially if possible trends cannot be captured or estimated accurately within the data record.
The target population may be defined in part by regulation. In some cases, the critical concern may be at the point of compliance, perhaps along the downgradient boundary of the site. Concentrations at other portions of the site may or may not matter from a regulatory viewpoint, as long as measurements collected from the point of compliance do not exceed applicable criteria. Even in such cases, however, it is usually difficult to estimate or predict changes along the compliance boundary unless measurements are also collected from other portions of the site. These measurements may be collected if for no other purpose than to establish and check the CSMconceptual site model. The effective target population is rarely confined strictly to the point of compliance.
3.2.2 Background Concentrations
For compliance purposes, project managers must determine what portion of the subsurface (regarded in four dimensions) adequately represents background concentrations in order to answer the following questions:
- Can the background population be unambiguously defined and sampled?
- Does background change over time?
- Is the local background population intermixed with potentially contaminated groundwater?
- Are groundwater gradients and flow paths consistent enough to ensure reliable monitoring of background conditions into the future?
- Are there multiple sampling points/wells dedicated to establishing and monitoring background levels?
Answers to these questions will facilitate good decisions as the project progresses and can ultimately reduce costs and avoid delays.
See Appendix A Example, A.1 Comparing Two Data Sets Using Two-sample Testing Methods
See Appendix A Example, A.3 Calculating Prediction Limits
Given the dynamic nature of the subsurface, measuring background at a single point in space and time is generally inadequate. Background measured at a single time gives no indication of whether background conditions might change in the future. A single background sampling point confounds spatial variability and actual contamination. Multiple background sampling points allow for (1) assessment of the presence of significant spatial variation; (2) faster accumulation of adequate background data for statistical purposes; and (3) a better understanding of the uncontaminated subsurface.
3.2.3 Multiple Source Areas
A good CSMconceptual site model is critical to statistical evaluations of overlapping plumes or multiple contaminant source areas. Questions relevant to these situations include:
- Must each plume be separately and independently assessed for compliance?
- Are the contaminants common to overlapping plumes?
- How will the sampling data be used to measure the relative impact and extent of each plume?
- Where should sampling points be placed or adjusted to optimize plume characterization?
- Are the contaminants from each source distinct enough (may apply only at some sites) to allow for a multivariate statistical ‘fingerprinting’ of each plume?
- How much sampling data are needed to adequately characterize the different sources?
- Are there differing aquifer zones and concentration profiles that vary with depth and must be analyzed separately for statistical purposes?
- Are the plumes in differing states of recharge or discharge? How will this impact what data must be gathered?
Again, a statistical approach based on the CSM and the answers it provides helps to ensure that the collected data are useful for making compliance decisions.
3.2.4 Monitored Natural Attenuation
See Appendix A Example, A.2 Testing a Data Set for Trends Over Time
A sound statistical approach can also help support the common remedy of monitored natural attenuation (MNA). Groundwater monitoring data at a sampling point can be initially tested for a statistically significant trend to determine whether a MNA remedy is or may be effective. However, consistent groundwater flow paths are essential, as are monitoring wells that accurately capture those paths. Later the groundwater monitoring data at a sampling point may be tested for a stabilizing trend. The amount of groundwater data needed will depend on the level of statistical confidenceLikelihood that a range of values will contain the population parameter of interest (NIST/SEMATECH 2012). required for detecting temporal trends and for deciding whether concentrations are projected to remain below criteria. Additionally, if monitoring is scheduled to continue indefinitely, the sampling frequency can be optimized statistically, but this will again require input from the CSMconceptual site model as well as the regulatory drivers governing the remedy.
3.3 Understanding the Data
Before conducting formal statistical evaluations, review the data. This review should include (1) reviewing data quality, (2) assessing the extent and usefulness of any historical data, and (3) exploring the data for general patterns and characteristics. One general way to aid in this understanding is through a collection of numerical and graphical statistical techniques known as exploratory data analysis (EDA, see Section 3.3.3). EDA can help to identify any data quality problems (such as anomalies or inconsistencies) as well as basic attributes of the data, such as its shape, spread (for example, standard deviation), and central tendency (for example, mean, medianThe 50th percentile of an ordered set of samples (Unified Guidance).).
3.3.1 Data Quality
Site data must be of sufficient quality to be statistically usable. Among the questions that must be answered in order to assess data quality include:
- Are quantitation limits low enough to determine whether criteria have been exceeded?
- Are there outliersValues unusually discrepant from the rest of a series of observations (Unified Guidance). (that is values unrepresentative of the overall population of groundwater measurements) that might falsely imply detection of a release?
- Are quantitation limits consistent over time, or does measurement precision vary, perhaps associated with changes in analytical methods or sample interferences or dilutions?
- Are nondetect data reported to quantitation limits or detection limits, and is there an understanding of the difference in measurement uncertainty depending on which reporting method was used?
- Are measurements collected frequently enough to accurately characterize groundwater elevations and whether those elevations change over time? See USGS guidance (USGS 2013) on components of water-level monitoring programs.
One broad-based approach for acquiring and assessing environmental data is USEPA’s seven-step DQOdata quality objectives process (USEPA 2006a). The DQO process provides basic guidance on systematic planning, develops performance or acceptance criteria, and identifies resources and references for this process. It can be helpful to review the DQO process at each stage of a groundwater investigation or remedial effort. The DQO steps shown in Figure 2 of the USEPA guidance include the following:
- State the problem.
- Identify the goals of the study.
- Identify information inputs.
- Define the boundaries of the study.
- Develop the analytic approach.
- Specify performance or acceptance criteria.
- Develop the plan for obtaining data.
USEPA’s DQO process is general enough to potentially incorporate different lines and types of data-based evidence. Statistics is one useful tool in this framework, as highlighted by USEPA’s Data Quality Assessment (DQA)The scientific and statistical evaluation of data to determine if data obtained from environmental operations are of the right type, quality, and quantity to support their intended use (USEPA 2002b). (USEPA 2006b). The DQA process evaluates whether the level of data quality will enable the DQOs to be achieved. This latter, more specifically statistical, process consists of a series of complementary steps. Table 3-1 includes these steps (see Figure 11 of USEPA's [2006a] document) and illustrates example tasks for the steps.
|
DQA Steps |
Example Tasks |
|---|---|
|
1. Review DQOs and sampling design. |
Goal: estimate plume contaminant mass within 10% relative error. |
|
2. Revisit DQOs if necessary. |
Check sample design to see if spatial grid of locations is feasible |
|
3. Conduct preliminary data review. |
|
|
4. Select the statistical test. |
95% confidence intervalStatistical interval designed to bound the true value of a population parameter such as the mean or an upper percentile (Unified Guidance). for total contaminant mass |
|
5. Verify the assumptions. |
Check normality of sample data; use nonparametricStatistical test that does not depend on knowledge of the distribution of the sampled population (Unified Guidance). test if data cannot be normalized. |
|
6. Draw conclusions from the data. |
Estimate total contaminant mass with 95% statistical confidence. |
Based on these steps, application of statistics should incorporate an iterative approach, including:
- up-front exploratory data analysis Section 3.3.3 to better understand the data set, its usability, and its representativeness
- a clear formulation of the study questions and the statistical inferences that need to be made
- selection of the appropriate target population (see Section 3.2.1) from which data will be drawn
- data quality assurance and quality control (QA/QC)—do the data meet required or appropriate QA/QC requirements?
- application of appropriate statistical methods, checks on the assumptions of those methods, and an assessment that reasonable answers have been obtained
Even with systematic planning, uncertainty is inherent in all scientific measurement. The level of uncertainty in a data set, however, must be low enough to answer the study questions with sufficient statistical confidence. In some cases uncertainties can be addressed by collecting additional data or using more sensitive analytical methods. In other cases uncertainty reflects a basic lack of knowledge about how the natural system functions. Identifying and managing uncertainty (ITRC 2011b) supports informed decisions in all stages of the project life cycle.
While not the focus of this document, standard practices can help achieve and maintain appropriate data quality. These practices include collecting field duplicates, maintaining the chain of custody, and implementing good analytical practices such as laboratory replicates, spiked samples, and standard solutions. Even with these practices, limits to the precision of laboratory instruments will exist because of low signal-to-noise ratios at very low concentrations.
For many sampling methods, simple modifications to the current sample collection procedures can serve to reduce monitoring variability. These modifications can reduce variability by directly addressing some sources of variation such as in-well stratification of contaminant concentrations and by mitigating the impact of other sources of variability by minimizing differences in sample collection procedures between sampling events. For no-purge sampling methods, it can be important to consider seasonal changes in vertical temperature gradients when comparing samples from different times (McHugh et al. 2011). For low-flow or no-purge sampling methods, variability can be reduced by collecting the samples from exactly the same depth within the well (high precision sampler placement). For sampling methods that require transfer of the sample from the collection device to the sample container, specific bottom-fill transfer procedures will reduce variability associated with volatile loss (Parker and Britt 2012).
Example: Variability and Trend Analysis
Groundwater monitoring data are often affected by high levels of variability unrelated to the long-term temporal trend (McHugh et al. 2011). For example, poor data quality or precision may result in multiple nondetect or tied values that can lessen the ability of statistical tests to correctly identify trends (what is known as statistical powerStrength of a test to identify an actual release of contaminated groundwater or difference from a criterion (Unified Guidance).; see Section 3.6.1.2). A large number of ties or nondetects may obscure the distribution of the data and limit the selection of statistical methods that can be used. These data may also prevent estimates of temporal autocorrelationThe correlation between observations on a single variable over successive intervals of time. This relationship is also called "serial correlation". Autocorrelation in temporal data is significant for time-series analysis (Unified Guidance; Burt et al. 2009). (see Section 3.4.4).
Selection of the time period to include in a trend analysis is also a trade-off between statistical power and interpretation of the results. A long time period can be evaluated as a whole or as multiple smaller data sets covering shorter time intervals. Use of shorter time intervals may be necessary to evaluate changes in attenuation rates (for example before versus after installation of an active remediation system). A single, larger data set (one that covers a longer time period) will have greater statistical power and is more likely to identify an actual trend with less variability associated with the estimated attenuation rate.
3.3.2 Historical Data
Even if not collected using systematic planning, historical data may be useful for statistical and compliance purposes, depending on data quality and comparability with more recent measurements. Pre-existing data can be examined for general trends over time and to assess whether background concentrations are relatively stable or whether they are inconsistent with past data. Such exploratory comparisons may shed light on hydrogeologic changes, data anomalies, or other patterns, and often provide a longer-term perspective of the site.
A large amount of data is not the same as a large amount of statistically usable data. To be statistically usable, all the data points meant to represent a particular target population must have been drawn from that population using a similar, if not identical, collection and measuring process. Historical data collection and analysis may not be consistent with current methods. Sampling and analysis in the past may have been different enough from the present to biasSystematic deviation between a measured (observed) or computed value and its true value. Bias is affected by faulty instrument calibration and other measurement errors, systematic errors during data collection, and sampling errors such as incomplete spatial randomization during the design of sampling programs (Unified Guidance). the older values in one direction or another, or to introduce unacceptable levels of uncertainty. Local groundwater conditions may also have changed to such an extent that the data are no longer physically representative of current conditions of interest.
Not all historical data are useful for formal statistical analysis or even EDA. Quantitation or detection limits change with different laboratories, with different methods, and with improved laboratory techniques, potentially making comparison of data collected over time difficult. A common complication is the lowering of quantitation or detection limits as technology improves, resulting in poor understanding of low concentration levels early in the data record. This progressive lowering of quantitation or detection limits can mistakenly appear to be a decreasing concentration trend in a time series plotA graphic of data collected at regular time intervals, where measured values are indicated on one axis and time indicated on the other. This method is a typical exploratory data analysis technique to evaluate temporal, directional, or stationarity aspects of data (Unified Guidance). if the nondetects have been replaced with some fraction of the quantitation or detection limit (for example, historically one-half the detection limit has been used). Be familiar with changes in laboratory and data collection methods over time when using historical data.
Historical data that were not collected as part of the current systematic planning process may be valuable during the exploratory phase and for informing or checking the preliminary CSM. However, these data may not have sufficient or comparable quality to be used in a formal analysis or to assess regulatory compliance. EDA (see Section 3.3.3) can be helpful in comparing newer data against older data and in establishing which time period of data collection best represents relevant groundwater conditions and offers sufficient data quality.
3.3.3 Exploratory Data Analysis
EDA refers to a collection of mostly informal, descriptive and graphical statistical tools used to explore and understand a data set. Generally, EDA includes numerical summary statistics such as measures of centrality (for example, mean, median), measures of spread (for example, standard deviation, variance, interquartile rangeThe middle range of an ordered set of sample values between the 25th and 75th sample percentiles (Unified Guidance).), and measures of shape (for example, skewnessA measure of asymmetry of a dataset (Unified Guidance). and kurtosisA measure of whether the data are peaked or flat near the mean. High kurtosis would show a distinct peak near the mean and drop off rapidly to heavy tails (NIST/SEMATECH 2012).), as well as graphical displays such as histograms, box plots, scatter plots, time series plots, and probability plots. Section 3.5 includes information on how to use EDA to test statistical assumptions.
EDA methods allow you to check data quality and select appropriate statistical methods. EDA methods can also confirm whether or not the underlying assumptions of statistical methods are met. For example, all parametricA statistical test that depends upon or assumes observations from a particular probability distribution or distributions (Unified Guidance). statistical tests assume that the data are drawn from a particular probability distribution, whether the normal, lognormalA dataset that is not normally distributed (symmetric bell-shaped curve) but that can be transformed using a natural logarithm so that the data set can be evaluated using a normal-theory test (Unified Guidance)., gammaA gamma distribution or data set. A parametric unimodal distribution model commonly applied to groundwater data where the data set is left skewed and tied to zero. Very similar to Weibull and lognormal distributions; differences are in their tail behavior, and the gamma density has the second longest tail where its coefficient of variation is less than 1 (Unified Guidance; Gilbert 1987; Silva and Lisboa 2007)., or some other known statistical model (see Section 5.6). An initial assessment using EDA can help determine whether or not the measurements approximate such a theoretical population. On the other hand, EDA is not designed to confirm groundwater contamination or to measure remedial success. EDA can test and check assumptions and tentatively identify important changes or patterns, but confirmation of those changes or patterns is best done with formal inferential tests.
The typical objectives for EDA are listed in Table 3-2.
For more information see Chapter 9, Unified Guidance, the NIST Engineering Statistics Handbook (2012), or Tukey 1977.
Graphical methods provide a critical overview of a data set. Histograms and probability plots are visualizations of the data shape that can help identify the best-fitting probability distribution, such as the normal or lognormal. Box plots graphically identify data characteristics such as the median, interquartile range (the measurement difference between the 25th and 75th percentiles; the latter percentiles are also known respectively as the lower and upper quartiles), range, and possible outliers. Scatter plots and time series plots can identify temporal trends and correlations.
EDA can also provide qualitative spatial analysis by plotting data on maps and observing spatial patterns. Such patterns are often enhanced by contouring or color-coding points on a map. Accurate spatial analysis generally requires a large number of sampling points, spread out to give good spatial coverage of the site. Although many software packages perform contouring, these packages may perform poorly if the data set is sparse (which is typically the case for corrective action sites; see, for instance, Siegel 2008). If a software package is used for contouring, you should carefully review the results for interpolation and extrapolation errorsTwo common errors in statistical inference are sample error and extrapolation error. An example of when extrapolation errors occur is in curve fitting for prediction outside of the data domain. Hypothesis testing does not account for extrapolation error (Forster 2002)..
Changes in groundwater quality or remedy effectiveness can be qualitatively evaluated by plotting temporal trends on a map (also known as a trend map) and identifying any apparent spatial patterns. Typically, a symbol or color or both are used at each sampling point to represent the nature and strength of the trend at that location (for instance, significantly decreasing). An alternative is to create a series of maps, each representing a particular time period, to evaluate changes in spatial patterns over time.
Project managers who lack expertise in statistics sometimes avoid an initial EDAexploratory data analysis to save time or money, especially when data exploration may not appear to be linked to specific compliance-related decisions. This practice is a false economy. Not only is EDA critical to properly navigating a systematic planning process and obtaining sufficient quantity and quality of data, it also helps avoid unnecessary or inappropriate statistical tests. As discussed in this document, all statistical procedures make assumptions about the nature of the data and the population from which those data have been collected. EDA helps to check these assumptions and select appropriate tests. For instance, a simple t-testA t-test, or two-sample test, is a statistical comparison between two sets of data to determine if they are statistically different at a specified level of significance (Unified Guidance). to compare two groups assumes that the two populations are normally distributed. If this assumption is not checked (for example, by using probability plots or normality tests), an incorrect decision may be made, especially if the data sets are highly skewed or contain many nondetects.
EDA is also critical for examining data quality and checking for data anomalies and comparability. For example, visual examination of a parallel time series plot may suggest that all the measurements from a given sampling date (across wells and contaminants) are outliers. Such anomalous patterns can indicate laboratory or field sample collection problems that might arise from instrument miscalibration or perhaps sample mislabeling or mishandling. These outlier values should usually be deleted from statistical analysis since (1) they do not represent true water quality and (2) the cause of the aberration is known.
More generally, EDA can identify data quality issues; it can be used to determine whether site data require special statistical adjustments or if data quality is inadequate to make reliable decisions. Data sets with frequent nondetects often fall into the first category, while incomplete data (data sets with missing measurements) or data with elevated reporting limits (such as that arising from high dilution factors during chemical analysis) may fall into the second. Data sets that are characterized as ‘completely usable’ after laboratory QA/QCquality assurance/quality control and data validation checks often contain significant anomalies and inconsistencies that are only identified after EDA. These cases show that EDA is an investment of project resources that can yield significant dividends.
3.4 Common Statistical Assumptions
Many assumptions are made during a groundwater investigation or in the course of long-term monitoring and compliance. This document focuses only on assumptions relevant to groundwater statistics and also assumes that the general principles of a systematic planning process have been followed during data collection and analysis, and the data are generally appropriate for the intended use (except perhaps for historical data).
Since parts of the systematic planning processes are statistical and iterative, exploratory statistical methods may be needed to ensure adequate data quality and quantity (see Section 3.3.3). Furthermore, statistical design considerations also inform systematic planning, so efforts to engage the systematic planning processes are integrated with the statistics discussed here. Nevertheless, the primary discussion assumes that data have already been deemed usable for statistical purposes. See also Section 2.1 for more planning considerations.
For sites with no existing data, follow a systematic planning process to ensure that planned measurements have sufficient analytical precision, that the questions of interest are clearly defined, and that sufficient observations will be collected from a well-defined target population. For sites with historical data, as discussed earlier, those data should be examined prior to formal testing to determine whether they are usable (see Section 3.3.2).
Perhaps the most important assumption is that sufficient data exist to conduct a valid statistical analysis. All statistical tests assume measurements are drawn from a larger (often unseen or unobservable) target population of potentially measurable values. The conclusion from a formal statistical test reflects an inference from the sample values to the larger population and makes a statement about that population as a whole. To make such an inference (for instance, to estimate a characteristic of the population like the overall mean concentration) within a specified level of accuracy, a minimum number of measurements, termed the sample size, is needed. Sufficient sample size varies by statistical method and depends also on the level of desired statistical certainty or accuracy. Information regarding sample size is presented for the methods in Section 5.
3.4.1 Nonrandom Sampling Points and Sampling Times
An independent or random sample can be representative of the target population and its variance, and is useful for formal statistical inference. For groundwater, however, the subsurface target population may or may not be well mixed. Though dynamic and four-dimensional (time plus three-dimensional volume), the degree of natural ‘mixing’ will depend on multiple complex factors, including but not limited to flow rates, soil or rock composition, porosity, aquitards and hydraulic barriers, recharge rates, and the types and nature of the contaminants being monitored.
Combined with a population that may not be well mixed, groundwater sampling of the subsurface is generally nonrandom. Usually, it is not possible—either logistically, physically, or conceptually —to sample the subsurface at random locations and at random times. Sampling points (for example, groundwater wells) are at fixed locations and sampling teams must go out to the field at preset and logistically convenient times. The CSMconceptual site model may also dictate general rules for sampling point locations, usually based on professional judgment.
If there is a high degree of natural mixing and homogeneity within the subsurface, over a given time period, it should not be necessary to randomize the sampling points or times of sampling. Similar statistical results should be obtained at any sampling point and the combined data should approximate an independent sample from the target population. More often, groundwater plumes have a distinctive spatial and temporal footprint, meaning that concentrations vary substantially by location and time of sampling. In these cases, the subsurface population is not naturally well mixed (randomized), and—since the sampling process itself is nonrandom—it may not be possible to treat the data as if it represents an independent subset of the target population. That is, it may not be valid to simply pool values across different sampling points and ignore the possibility of spatial correlation between different wells, or to ignore the possibility of temporal correlation among a series of samples from a single sampling point.
Examples where correlation can be problematic include (1) a well with regular seasonal fluctuations that is only sampled during the ‘peak-concentration’ summer months; or (2) sampling two spatially-correlated wells near the source of a plume and then assuming they accurately reflect the magnitude of the remaining plume area.Special geostatistical techniques such as krigingA weighted moving-average technique to interpolate the data distribution by calculating an area mean at nodes of a grid (Gilbert 1987). (see Section 5.14.2) have been developed to perform spatial analyses in the presence of significant spatial correlation. Unfortunately, an accurate kriging analysis generally requires a larger number of sampling points, often laid out on a systematic sampling grid, so this may be difficult at some sites.
It also may be possible to account or adjust for temporal correlation between adjacent sampling events at a single sampling point, especially if the lag time between measurements at the same location is small (for example, monthly or less), and the data set consists of a longer series of values. It is also important that enough different times of the year are sampled so that seasonal patterns are not missed. Again, a larger amount of data is usually required to both identify the presence of significant temporal or spatial correlation, and then to adjust the data so as to minimize any adverse statistical impact of that correlation.
In general, an independent sample (or one that has been adjusted for the presence of correlation) is important because:
- All standard statistical tests assume that the input data (if otherwise unadjusted) have been independently drawn from an underlying groundwater population of possible measurements (the target population).
- Since only a small fraction of any subsurface population can be observed, an independent sample ensures that all of the population has a chance to be selected and measured. By contrast, nonrandomized samples from a poorly mixed population tend to be biased and unrepresentative of the underlying target, possibly ‘missing’ important features of the measurement distribution.
3.4.2 Nondetects and Uncertain Measurements
Many chemical contaminants occur in very small concentrations or can be difficult to measure. This situations leads to many nondetectsLaboratory analytical result known only to be below the method detection limit (MDL), or reporting limit (RL); see "censored data" (Unified Guidance). or to measurements with high degrees of unknown analytical uncertainty (for instance “J-flagged values” that are less than laboratory quantitation limits). Nondetects or “less than" values are technically known as “left-censored" values. Data censoring complicates statistical evaluations, especially when a large portion of a data set is nondetect. Uncertain measurements lead to data sets with varying analytical precision, also complicating statistical analysis. Although it may require more mathematically involved adjustments, the impact of nondetects (see Section 5.7) and uncertain measurements should be considered in statistical tests. Failing to utilize such observations can severely bias statistical estimates; adjusting for nondetects in the wrong way can also negatively impact the analysis.
3.4.3 Normality
Standard parametric statistical tests assume that the sample data are either normally distributed or follow another known statistical model (such as a lognormal or Weibull distributionA parametric unimodal distribution model commonly applied to groundwater data where the data set is right- or left-skewed. Also used for failure analysis. Very similar to gamma and lognormal distributions; differences are in their tail behavior, and the Weibull density has the smallest tail (Unified Guidance; Gilbert 1987; Silva and Lisboa 2007; Abernethy 2010).). Many environmental and groundwater data sets are either nonnormal (skewed, lognormal, gammaA gamma distribution or data set. A parametric unimodal distribution model commonly applied to groundwater data where the data set is left skewed and tied to zero. Very similar to Weibull and lognormal distributions; differences are in their tail behavior, and the gamma density has the second longest tail where its coefficient of variation is less than 1 (Unified Guidance; Gilbert 1987; Silva and Lisboa 2007).) or contain too many nondetects to accurately check the normality assumption. In some cases, sample data can be normalized by mathematical transformation, for instance, by taking logarithms or square roots of the original results. Nonparametric statistical tests may be used when data do not seem to fit any known distribution. Either way, selection of an appropriate statistical method usually requires an initial check for normality (see Section 5.6).
3.4.4 Temporal Independence
As noted in Section 3.4.1, each measurement drawn from a population of groundwater measurements is assumed to be statistically independent of every other measurement. What this means statistically is that the occurrence of an event (sample value) makes it neither more nor less likely that a second event (sample value) occurs. Practically, this means that each sample value should provide an independent ‘snapshot’ of groundwater concentrations, not influenced by or correlated with other measurements. Otherwise, statistical results and summaries are likely to be biased and to underestimate the true variance.
In particular, to approximate independence over time at a fixed sampling point, sample measurements should not be collected too quickly after one another. Instead, a lag time should be allowed between sampling events, ideally governed by the degree of temporal correlation (that is, numerical similarity between consecutive or closely-timed sampling events) in the time series. Temporal correlation can be induced by a variety of physical factors, including among others the rate of groundwater flow, composition of the soil matrix, and the measuring process itself.
How long you should wait between sampling events will depend on site-specific conditions. A common rule of thumb is to sample no more frequently than quarterly, though this ‘rule’ is not based on formal studies. The Unified Guidance suggests that sites conduct a pilot study to estimate the correlation over a year’s time at two or three representative wells. These correlation estimates can be utilized to establish a site-specific sampling frequency. The degree of temporal correlation can be checked using standard tools for time series analysis, like the sample autocorrelationCorrelation of values of a single variable data set over successive time intervals (Unified Guidance). The degree of statistical correlation either (1) between observations when considered as a series collected over time from a fixed sampling point (temporal autocorrelation) or (2) within a collection of sampling points when considered as a function of distance between distinct locations (spatial autocorrelation). function (see Section 5.8.3).
One common implication of the need for independence is that laboratory replicates and field duplicates should not be treated as independent measurements, since by design they should be highly correlated. To avoid such correlations, replicates and duplicates should either be averaged prior to statistical analysis or one duplicate or replicate from each set should be randomly selected to be included in the analysis data set. Deterministic rules such as always selecting the highest-valued replicate are discouraged, since they may bias the overall mean estimate but perhaps more importantly may cause the variance to be underestimated.
Another implication is that physical independence is not a guarantee of statistical independence. Even using Darcy’s equation or similar method to ensure that physically distinct volumes of groundwater are sampled on different events does not necessarily ensure those measurements are statistically independent. Independence can be affected by other factors besides groundwater flow rates, including physical factors such as soil sorption and turbidity or the analytical measurement process itself (for example, periodic instrument miscalibration that biases some measurement batches but not others).
Seasonality is a special form of temporal dependence that can bias test outcomes if, as is typical, groundwater is not sampled at truly random times. If seasonality is present, a longer series of measurements is generally necessary to both characterize the seasonal pattern and to de-seasonalize the data (see Chapter 14.3.3, Unified Guidance) in order to remove the extraneous trend.
Example: Seasonality
In an extreme case, suppose contaminant concentrations always peak above a compliance criterionGeneral term used in this document to identify a groundwater concentration that is relevant to a project; used instead of designations such as Groundwater Protection Standard, clean-up standard, or clean-up level. in the summer, but always drop below the criterion during the winter, with no long-term trend. Then, routine annual sampling in the summer (but not in the winter) will tend to identify the well as more contaminated than it really is, or perhaps falsely indicate that the long-term average exceeds regulatory limits.
Correlated data will both underestimate the true variance and represent the equivalent of a much smaller set of independent measurements. In fact, if the first order or ‘lag-1’ temporal correlation is equal to α, the number of equivalent independent values will be approximately n(1–α)/(1+α) (Chatfield 2004). This means that a series of 20 measurements with a first order correlation of 0.3 will be roughly equivalent to only 11 independent observations.
3.4.5 Outliers, Identically Distributed Measurements
Any sufficiently-sized set of measurements drawn from a given population is assumed to have an identical distribution to that of the parent population. In traditional upgradient-to-downgradient comparison tests, the groundwater measurements at both upgradient and downgradient sampling points are assumed to be identically distributed unless the downgradient wells become contaminated. However, if there is significant natural spatial variability, the local distributions from well to well may differ even if the site is ‘clean.’ In another example, outliers are measurements that are either errors of some sort or do not come from the same statistical population as the rest of the data. Including one or more outliers in a background data set can dramatically affect statistical evaluations and often greatly decreases the statistical power of such tests. Check for both outliers and spatial variability in any groundwater data evaluation (see Section 5.10: Identification of Outliers and Section 5.5: Trend Tests). Outliers should generally be kept as part of the data set unless there is reasonable evidence that they are the result of an error.
3.4.6 Temporal Stability
Several groundwater statistical tests assume the input data are stable over time. This means the measurements should not exhibit obvious trends, but instead should be stable around a fixed mean. This assumption applies to t-tests, analysis of variance (ANOVA), confidence intervals around the mean, prediction limits, and control chart limits calculated using background data. Lack of temporal stability can substantially bias test outcomes, in large part because the estimated variance will be too high (and much higher than the nominal variance assumed by the test). When the sample data do not appear to be temporally stable, consider formal trend tests as an alternative or explicitly adjust for the apparent trend when designing the statistical method.
More generally, temporal stability and temporal stationarityStationarity exists when the population being sampled has a constant mean and variance across time and space (Unified Guidance). are the same thing. Stationarity as a concept is more general in that it can also refer to spatial stationarity, referring to a local mean and variance that are stable across the site.
3.5 Testing Assumptions
EDAexploratory data analysis is described in Section 3.3.3 and is typically the first step in understanding data at a site and in helping to check the assumptions listed in Section 3.4. This section provides some guidance on how to implement EDA for testing statistical assumptions. Appendix F includes further information about checking the underlying assumptions of statistical tests. Effective EDA requires a decision logic or statistical process to sort through the decisions leading to a particular statistical design (see Section 3.6). The EDA process for each site will be different, but a general outline might include the following:
- Testing normality. Normality of the data distribution can be checked with formal tests such as the Shapiro-Wilk or with more subjective methods like probability plots. It may also be possible to normalize the data using a mathematical transform (for example, log, natural log) but note that (1) any subsequent parametric test must be run on the transformed data values and (2) back-transforming the results of the test may induce unacceptable bias. If the data cannot be sufficiently normalized, other distributions can be checked (such as Weibull or gamma); some parametric tests exist for these distributions. Unless the sample size is reasonably large, accuracy or statistical power may be lost when using a nonparametric test procedure. If possible, use a parametric test whenever the original data pass a normality test, or select an alternative nonparametric test method (see Section 5.6).
- Testing for outliers. Formal outlier tests, such as Dixon's or Rosner's test, usually assume normality. Therefore, check data for normality prior to running an outlier test. For data that cannot be normalized, use a nonparametric test method to minimize the effects of possible outliers. Including outliers in a statistical analysis, especially if they are part of a background data set, can lead to substantial loss of statistical power for detecting real changes. Sometimes, a nonparametric alternative will lessen the impact of one or more outliers, even if they are not removed prior to analysis. Examples include using a Wilcoxon rank sum test instead of a t-test, a Kruskal-Wallis test instead of a parametric analysis of variance (ANOVA), or a Mann-Kendall or Theil-Sen line test instead of a linear regression.
- Testing for background stability. Use formal trend tests such as Mann-Kendall or the Theil-Sen line test to identify statistically significant downward or upward trends over time at compliance points without reference to background concentrations. Comparison tests against background, such as prediction limits, control charts, and tolerance limits also all assume that the background data are stable over the time frame being assessed. In these cases, apply the trend test to the background data as a diagnostic procedure to check the assumption. If a trend is found in background during this diagnostic check, a switch from, for instance, a prediction limit to a formal trend test at the compliance point may be required.
- Testing for spatial variation. Substantial spatial variation among sampling points can negate the use of traditional interwell (upgradient-to-downgradient groundwater) tests in favor of intrawell testing. Check for the presence or absence of spatial variation. If there are multiple background sampling points, these points can be compared formally with an analysis of variance (ANOVA) or informally using side-by-side box plots. If only one or no background sampling points exist, a similar check can be run on sampling events from compliance points that are known to be uncontaminated on the basis of other lines of evidence.
- Testing for temporal independence. Data that do not approximate independence through time can substantially bias test outcomes. Checking for independence requires a series of measurements, either from a single sampling point or from multiple sampling points all sampled on the same event. First check for trends or systematic patterns on a time series plot. If identifying a trend is of prime interest, independence should not be tested on the original data series, but rather on the residuals from the estimated trend if a linear regression is used. Alternatively, a nonparametric trend test like the Mann-Kendall or Theil-Sen line test might be used.
- Accounting for nondetects. A substantial fraction of nondetects often makes it impossible to normalize a data set or to accurately check for normality. Sometimes, a switch to an alternative nonparametric test method is warranted. As noted earlier, however, if the sample size is small a substantial loss in statistical accuracy or powerSee "statistical power." may occur. Section 5.7 discusses managing nondetects.
3.6 Statistical Design Considerations
Statistics play a crucial role in properly evaluating groundwater throughout the project life cycle. Therefore statistical design, which is the intentional planning for statistical analysis and data collection, should always occur at the beginning of the project rather than the end. Ideally, statistical design should occur as part of a systematic planning process in the context of the project’s DQOsdata quality objectives and DQAdata quality assessment process. To link this process more specifically to groundwater analysis, consider the following questions.
3.6.1 How good are my decisions?
Every statistical decision includes uncertainty. Upfront statistical design often allows the analyst to anticipate the level of uncertainty attached to later statistical test results and to adjust the design if that uncertainty is unacceptable to stakeholders. Well-designed evaluations attempt to specify and control not only the confidence levelDegree of confidence associated with a statistical estimate or test, denoted as (1 – alpha) (Unified Guidance). of the test procedure, but also the expected false positive rates and false negativeIn hypothesis testing, if the alternative hypothesis (Hᴀ) is true but is rejected in favor of the null hypothesis (H₀) which is not true, then a false negative (Type II, β) error has occurred (Unified Guidance). rates or statistical power (see Section 3.6.2).
3.6.1.1 False Positives and False Negatives
A false positiveIn hypothesis testing, if the null hypothesis (H₀) is true but is rejected in favor of the alternate hypothesis (Hᴀ) which is not true, then a false positive (Type I) error has occurred (Unified Guidance)., Type I error, or alpha refers to rejecting the null hypothesisOne of two mutually exclusive statements about the population from which a sample is taken, and is the initial and favored statement, H₀, in hypothesis testing (Unified Guidance). or conclusion about a population when it is actually true. A false negativeIn hypothesis testing, if the alternative hypothesis (Hᴀ) is true but is rejected in favor of the null hypothesis (H₀) which is not true, then a false negative (Type II, β) error has occurred (Unified Guidance)., Type II error, or beta refers to failing to reject the null hypothesis or conclusion when it is actually false.
Since both false positives and false negatives can have regulatory and financial consequences, you should attempt to minimize both to the degree practicable, and consider both in the statistical design.
Example: False Positives and False Negatives
A ‘false positiveIn hypothesis testing, if the null hypothesis (H₀) is true but is rejected in favor of the alternate hypothesis (Hᴀ) which is not true, then a false positive (Type I) error has occurred (Unified Guidance).’ would occur if the assumption that a site’s groundwater is ‘clean’ is wrongly rejected; that is, the statistical evaluation erroneously concludes the groundwater is ‘dirty.’ A ‘false negative’ occurs when the groundwater is actually ‘dirty’ but the hypothesis of clean groundwater is accepted.
3.6.1.2 Statistical Power
Statistical power is the complement of the false negative rate. It represents the probability that the null hypothesis will be rejected when the alternative hypothesis is true—the probability of not committing a Type II error. Higher power is always desirable since it implies that a correct decision will likely be made. Similarly, high statistical confidence is desirable since the confidence level indicates how likely it is that the null hypothesis will be accepted when it is true—the probability of not committing a Type I error. In the previous example, a high confidence level translates to a high probability of correctly deciding that ‘clean’ groundwater is indeed ‘clean.’
3.6.1.3 Statistical Significance
Statistical significance is also required to assess the certainty of results. A statistically significant test conclusion is one with a low probability of occurring by chance. Often, the significance level of a test is equated with the false positive rateThe frequency at which false positive or Type I error occurs. The false positive rate, or α (alpha), is the significance level of a hypothesis test. If a test is at an α = 0.01 level of significance there would be a 1% chance that a Type I error would occur (Unified Guidance).. A low false positive rate then sets a high bar for reaching significance, because the lower the false positive rate, the larger the difference, change, or trend in a data set needs to be in order to register a statistically significant result. By corollary, apparent differences that are due simply to chance variation are less likely to be identified at the lower the false positive rate.
Another helpful way to think of statistical significanceStatistical difference exceeding a test limit large enough to account for data variability and chance (Unified Guidance). A fixed number equal to alpha (α), the false positive rate, indicating the probability of mistakenly rejecting the stated null hypothesis (H₀) in favor of the alternative hypothesis (Hᴀ). Or, the p-value sufficiently low such that the analyst will reject the null hypothesis (H₀). is as the strength of the evidence against the null hypothesis. The more inconsistent the statistical evidence compared to the null hypothesis, the lower the probability that those specific results would have been observed, assuming the null hypothesis is true. Numerically, this probability is expressed by what is called a p-valueIn hypothesis testing, the p-value gives an indication of the strength of the evidence against the null hypothesis, with smaller p-values indicating stronger evidence. If the p-value falls below the significance level of the test, the null hypothesis is rejected.. P-values are commonly reported in statistical software to express the statistical significance of a test result, and measure how unlikely an observed set of results is relative to the null hypothesis.
3.6.2 What are site-wide false positive rates and power curves?
As discussed above (Section 3.6.1), the false positive rate for a single statistical test is the probability that the test will falsely indicate a statistically significant result when none exists. Since groundwater monitoring generally involves testing of multiple chemicals at multiple sampling points, the probability that at least one of those tests will falsely indicate a significant result is much higher than the individual test false positive rate. This alternate probability of error is known as the site-wide false positive rate (SWFPR)The design probability of at least one statistically significant finding among a network of statistical test comparisons at a group of uncontaminated wells (Unified Guidance)..
To control the SWFPR and keep the number of false positive decisions to a minimum, Chapter 6.2, Unified Guidance, recommends designing any detection monitoring program to have an annual, cumulative SWFPR of 10%, regardless of the number of individual statistical tests that are run each year. To achieve this target, you can calculate the per-test false positive error rates for a specified number of tests using the equations found in Chapter 6.2.2, Unified Guidance. ‘Per test’ here refers to each sampling point and chemical combination statistically evaluated for compliance (for example, 10 chemicals measured in each of 5 compliance wells semiannually results in 100 annual tests). Some statistical software packages will also perform this calculation.
Ensuring an SWFPR of 10% at many sites entails assigning a very low false positive error rate to each individual test. This in turn tends to reduce the statistical power of those tests, since power always depends on factors such as sample size, significance level (Type I error rate, alpha), and the size of the difference or change in concentrations you want to detect (also known as the effect size). The effect in groundwater is often expressed as an increase over background in units of standard deviations (calculated from the background data). A large change in groundwater quality is easier to identify than a small change, so if the targeted effect size is large, the test will have higher power; conversely, smaller targeted effect sizes are associated with lower power.
Power curves may be used to estimate and visualize the statistical power of a test, or equivalently, a test’s ability to correctly identify a ‘significant increase’ in chemical concentrations above background. A typical power curve graphs the statistical power of a test against a range of possible effect sizes (in terms of standard deviations above background); the effect size can be translated from standard deviations into concentration units. USEPA’s Unified Guidance recommends regular use and reporting of power curves when designing statistical monitoring programs (see Chapter 6.2.3, Unified Guidance). This document also provides benchmark USEPA reference power curves (ERPC) with which to assess the adequacy of site-specific power curves. Generally, statistical software is needed to prepare power curves.
Because an inherent relationship and tradeoff exists between statistical power and the false positive rate of a test (that is, the lower the significance level, the lower the power), there is also a tradeoff between the site-wide false positive rate (SWFPR) and power. Maintaining a balance between an acceptable SWFPR and sufficient statistical power is important to ensure that groundwater monitoring programs are protective of human health and the environment, while not placing undue burdens or unreasonable risk of false detections on responsible parties. To achieve this balance, the Unified Guidance recommends that the annual, cumulative SWFPR target be set at 10% and that the USEPA reference power curves be used to demonstrate that each single statistical test can detect a three or four standard deviation increase in groundwater contamination above background with reasonable power.
In practice, meeting these targets simultaneously at most sites—given the limited amount of groundwater data usually available or feasible—requires a three-point design strategy.
- Examine the monitoring parameter list to see if any of the chemicals or indicators might be unrelated or perhaps distantly related to what would be present in groundwater should contamination actually occur. Eliminating chemicals from monitoring equates to fewer overall statistical tests, a smaller SWFPR, and greater power for the remaining tests.
- The Unified Guidance recommends the Double Quantification Rule (DQR), instead of formal statistical testing, for any monitoring parameter that has never been detected in background. The DQR simplifies the assessment of such parameters, since you only need to observe quantified detections on two consecutive sampling events to identify a significant change in groundwater quality. Additionally, removing those parameters from formal testing again lowers the SWFPR and improves the statistical power of the remaining formal tests.
- Institute a formal re-testing strategy (see Section 3.6.6) any time tests such as prediction limits, control charts, or tolerance limits are being used for release detection.
3.6.3 How much usable data do I have or need?
The statistical power, accuracy, and statistical confidence (see Section 3.6.1) of an analysis depend on the number of statistically usable measurements (also termed the sample size). As a general rule for parametric tests and many nonparametric ones as well, the larger the sample size the greater the power and the smaller the decision error risk (false positives and false negatives). Unfortunately, the relationship between sample size and statistical performance may be complicated and is somewhat different for each test. To minimize decision error risk, sample sizes should be determined ahead of time, if possible, as part of the design process.
Data usability depends on how closely the data set approximates an independent, identically-distributed sample and on how well those data represent the target population. Although it is difficult to verify these assumptions in a groundwater analysis, the statistical design and CSMconceptual site model should guide when and where to sample so as to best match the target population, minimize correlations between sampling events, and enable the collection of data related to the study questions. How, where, and when data are sampled all impact data usability and should be considered during statistical planning.
As a caution on sample size, while many statistical tests can be computed with just a handful of measurements (sometimes as few as three), such tests tend to have unacceptably low statistical power or high false positive rates. With parametric methods, critical points in published statistical tables or in software account for the desired false positive rate (or significance level) but give no indication of statistical power. Conversely, nonparametric statistical intervals (for example, prediction limitsIntervals constructed to contain the next few sample values or statistics within a known probability (Unified Guidance).) computed with small sample sizes have high power but also very high false positive rates; nor can the false positive rate be specified in advance by the user without increasing the sample size.
Example: Background Sample Size
As an example of the impact of insufficient data, consider the achievable false positive rate using a nonparametric prediction limit based on the maximum observed background value to test for contamination at a compliance well when collecting a new measurement. Figure 3-2 plots background (BG, used in the figure) sample size versus the expected false positive rate of the test. The horizontal limits on the graph indicate standard 5% and 1% significance levels. The background sample size must be at least 19 to achieve 5% significance, and at least 99 to achieve 1% significance. Only 5 background values nets a 17% chance of falsely detecting a release, while 10 would result in a 9% false positive risk. The prediction limit itself can be computed with just a single background measurement, despite the high decision error risk (50%). It is also the case (not shown) that a much lower sufficient sample size can be used if formal retesting is pre-specified and incorporated into the procedure.
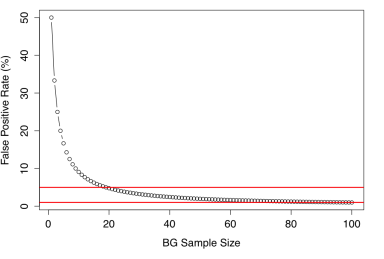
Figure 3-2. Background sample size versus the expected false positive rate of the test.
It is also difficult to judge whether a parametric statistical model fits the available data when the sample size is small. One method is to use ‘bootstrapping’ to augment the information contained in a small sample via computer-simulated resampling. Unfortunately, while standard bootstrapping is a valuable tool in moderate to large data sets for estimating sampling variability, it gives unreliable results for very small sample sizes and should be avoided. There is no substitute for real data. If the sample size is too small, additional measurements must be obtained prior to statistical analysis.
Most guidelines on sample size for groundwater tests recommend at least 8 to 10 background measurements when constructing prediction limits, control chartsGraphical plots of compliance measurements over time; alternative to prediction limits (Unified Guidance)., or tolerance limitsThe upper or lower limit of a tolerance interval (Unified Guidance)., and roughly the same number of compliance point measurements when calculating trend tests or confidence intervals. Some exceptions to these guidelines exist, but importantly, none of the recommendations directly indicate what statistical power will be achieved during parametric testing, or how much false positive rate control is likely in nonparametric tests. To figure both power and the expected false positive rate, further pre-planning is necessary. For some parametric tests without re-testing, you can use a minimum sample size formula to calculate the required sample size, as long as (1) a rough estimate of the variance is either known or can be bounded, and (2) you can specify the minimum difference of importance that should be detected.
Unfortunately, analytical calculations of statistical power quickly become complicated depending on the type of test and application. Adding retesting to standard prediction limits or control charts dramatically changes the way minimum sample sizes must be computed, as does the less-than-mathematically-tractable nature of combined Shewhart cumulative sum control chart (Shewhart-CUSUM) control charts (see Section 5.13). In many cases, power and minimum sample size characteristics of a method must be simulated on a computer, so that professional statistical assistance may be required. One help in this regard is that the Unified Guidance provides pre-computed sample size and power values for many scenarios involving prediction limits with retesting (though not for Shewhart-CUSUM control charts).
3.6.4 What are the critical contaminants?
The selection of which contaminants to monitor might seem at first to be strictly a decision for regulators and responsible parties. Often the list of monitored contaminants is set as part of the regulatory record, based on the composition of the contaminant sources, interaction of those contaminants with the local hydrogeology (including mobility, persistence, toxicity), and at times political sensitivities. Nevertheless, consider the impact of the monitoring list during the statistical design phase because it can affect statistical results. For instance, the more chemical parameters subject to formal statistical testing, the larger the resulting risk of making false positive decisions, and the greater the difficulty in managing that risk.
In some cases, chemicals on the monitoring list may be only distantly, or not at all, related to source composition, meaning that detection of those parameters is not indicative of site contamination. Removing these chemicals from formal monitoring can help optimize analytical resources, improve compliance decisions, and allow the use of more powerful statistical tests for the remaining contaminants. Also, the list of contaminants should be screened for statistical usability. Parameters that are heavily nondetect, that have low analytical precision, or that are only sampled in a small number of locations or across a small fraction of the site may be difficult to statistically analyze, especially within desired bounds of statistical error or confidence.
3.6.5 Should I use interwell or intrawell sampling?
Comparisons of compliance wells against local background data usually take one of two forms: interwell tests of upgradient versus downgradient wells, or intrawell tests of earlier versus more recent measurements at each compliance well (see Section 3.1). The type of comparison that is most appropriate depends on the specific contaminants and the nature of local hydrogeologic conditions. Substantial natural spatial variability may necessitate intrawell methods, a condition which can be identified in part by using graphical EDAexploratory data analysis tools (see Section 3.3.3) and diagnostic statistical tests. At some sites, both intrawell and interwell tests may be appropriate, because the degree of spatial variation may vary by contaminant (for example, levels of naturally-occurring chemicals may differ spatially from anthropogenic contaminants).
Intrawell methods are also the method of choice when attempting to identify trends at individual sampling points or when evaluating post-remedial progress in contaminant reduction. In these cases, local background may not be relevant to the comparison or may not be stable enough over time to allow the use of interwell tests.
3.6.6 Should I retest and how?
Long-term monitoring at many sites requires years of routine sampling at fixed intervals. If a new round of sampling at a given sampling point is inconsistent with background levels, evidence exists of possible contamination or a change in conditions. To confirm whether the apparent change in concentrations is real or simply due to chance sampling variation or the impact of an outlier, retesting may be needed. Retesting—collecting and testing one or more new, independent groundwater sample at that sampling point after the initial test—tends to confirm actual changes and simultaneously eliminate most false indications.
Because the amount of new data collected at a given sampling point during any sampling event is small (often one new measurement), retesting is generally imperative for a successful detection monitoring program. Retests must be explicitly built into the statistical procedure and incorporated into the statistical design that is established during project planning. All facets of retesting—including how many resamples to collect, how much independent background data are available, and the decision rules used to confirm or refute an initial indication—affect the statistical power and accuracy of groundwater tests. Consult Chapter 19, Unified Guidance, for additional information.
3.6.7 Does my monitoring network need to be optimized?
Depending on the study question, a monitoring network might include more sampling points or be sampled more frequently than is actually necessary. Conversely, there may be inadequate spatial or temporal coverage of the site suggesting that either additional sampling points should be added to better characterize complex spatial trends or more frequent sampling at existing wells should occur. Both types of questions are part of monitoring network optimization.
Good statistical design should document networks that exhibit statistical redundancy in the numbers and placement of sampling points, or that are sampled more often than needed, and estimate the degree of redundancy present. In general, a high degree of spatial correlation between sampling points or a large temporal correlation between consecutive sampling events indicates statistical redundancy. Methods to identify redundancy and optimize your monitoring network are described in Section 4.5.3 and Section 5.14. Ideally, any network should be designed to most efficiently answer the study questions, while not wasting sampling and analytical resources.
It is also important to identify networks that provide too little statistical information to adequately characterize the site. In these cases, the spatial sampling design can be optimized by adding new sampling points at the most effective locations, or by increasing sampling efforts at existing wells to ensure compliance decisions can be made with adequate statistical confidence. Methods to optimize ‘by addition rather than subtraction’ are described in Section 4.5.3 and Section 5.14, generally relying on (1) locating specific site areas with the largest statistical uncertainty and fewest wells, and (2) determining whether trends over time are highly uncertain and linking this uncertainty to the current sampling frequency.
3.6.8 Is geostatistical or spatial analysis of groundwater necessary?
Geostatistical methods can be powerful tools for mapping and characterizing concentration or mass-flux patterns across a site. Geostatistical analyses, for instance, produce isopleth maps such as isoconcentration contour maps. Generating such maps and estimates usually requires more sampling points (sometimes arranged in a systematic pattern or along linear transects) than are available or feasible at many sites. As such, the statistical design should critically examine whether geostatistical analysis is necessary prior to well placement. Furthermore, the best sampling design for spatial analysis (for example, systematic grid) may not coincide with the requirements of the CSMconceptual site model, where wells may be sited along presumed preferential pathways or grouped near source areas.
Common sampling designs for spatial analysis include random sampling, systematic sampling, or multi-stage sampling. Random sampling of an aquifer (that is, by randomly locating sampling points) helps to ensure a low level of statistical biasQuantitative term describing the difference between the average measurements made on the same object and its true value; see "bias" (NIST/SEMATECH 2012). in the data set, but often cannot be done because of physical obstacles (such as buildings) or logistical difficulties in locating and drilling at truly random coordinates. It also may be less efficient than systematic designs in estimating the variance of a spatially-correlated or spatially-stratified population. Systematic sampling is useful when uniform spatial coverage is desired or when attempting to identify localized contaminant plumes (such as hotspots), but may be cost-prohibitive for many groundwater sites unless the sampling points consist of temporary wells or perhaps field sensors.
Multi-stage sampling is a design option that can more efficiently use sampling resources and yet allow for spatial analysis. This design entails initially obtaining a higher density of screening or semi-quantitative data that are then used to focus the collection of samples to be analyzed using more costly fixed-based laboratory analysis. Inexpensive field screening or direct push technologies may be a viable option for increasing the spatial resolution, as an alternative to drilling a smaller number of permanent wells only in locations targeted by professional judgment. Multi-stage sampling strategies must be developed during the statistical design phase.
Sampling points may also need to be stratified or apportioned into spatial groupings to represent distinct statistical populations or subpopulations. Such groupings may include upgradient and downgradient zones or reflect different aquifers, hydrostratigraphic units, or multiple screening depths.
3.6.9 Can I use field screening or the Triad approach?
On-site remediation of groundwater requires accurate characterization and understanding of any subsurface plumes. Often, the expense involved with drilling permanent wells and then using sophisticated analytical methods to measure each physical sample (particularly for organic chemicals) precludes locating more than a few sampling points relative to the areal extent of the site. Regulatory requirements, for instance under the Resource Conservation and Recovery Act (RCRA), have generally considered these realities so that a typical RCRA waste site is required to have a minimum of only one upgradient well and three downgradient wells.
A parallel concern is that less expensive field screening techniques were in the past typically associated with substantially greater levels of analytical uncertainty, making it difficult to accurately measure chemicals at low concentrations. USEPA has recognized the significant progress in sampling and measurement technologies, and that lower analytical uncertainty in individual laboratory analyses is often more than balanced by the large risk of decision error introduced from having too few sampling points. This understanding supports USEPA’s Triad approach (see Triad Implementation Guide, ITRC 2007b).
Triad applies three key concepts to the statistical and sampling design at a cleanup site:
- Systematic planning, including development of a CSMconceptual site model, upfront assessment and management of the risks of decision error and uncertainty, and allowance for the CSM to evolve as new information comes to light from sampling activities
- Dynamic work strategies, in which pre-approved decision logic is used to flexibly adapt the sampling design and subsequent sampling activities to the information generated
- ‘Real-time’ measurement technologies, including either rapid turn-around analyses from a traditional laboratory, or field-based screening and measurement methods, and direct push technologies.
The Triad approach consciously trades the lower analytical uncertainty associated with traditional laboratory and sampling procedures for the benefits gained from less expensive individual measurements, quicker turn-around time, and the statistical reality that more sampling points are needed to accurately characterize contaminated groundwater plumes than are typically available using traditional sampling plans. The gain in decision certainty from a larger number of, say, field screening measurements can often outweigh the better analytical precision of a small number of laboratory-based analyses.
Whether the Triad approach is useful at a particular site depends on whether more inexpensive methods of measurement exist for the contaminants, or for surrogates of those chemicals, and a proper weighing of the potential gains in project costs, flexibility, and decision certainty. All of these factors must be addressed in the systematic planning phase.
Publication Date: December 2013